NinjaTrader 8 – Signal Chart Setups 1 – Unleashing the power of the DTB Traders Toolkit
To understand what price is doing and where it is likely to go next, a great chart setup is needed, without it you are left in the dark and at the mercy of highly programmed algorithms and institutional traders with highly developed systems. Don’t be that guy!
This powerful setup includes the following indicators as part of the chart template “Signal Chart Combo 1 DTBTT00”:
-
RSI
-
DTB Shadow Trading Divergence
-
DTB EMA
-
ATR
-
DTB BreakOut Volume x 4
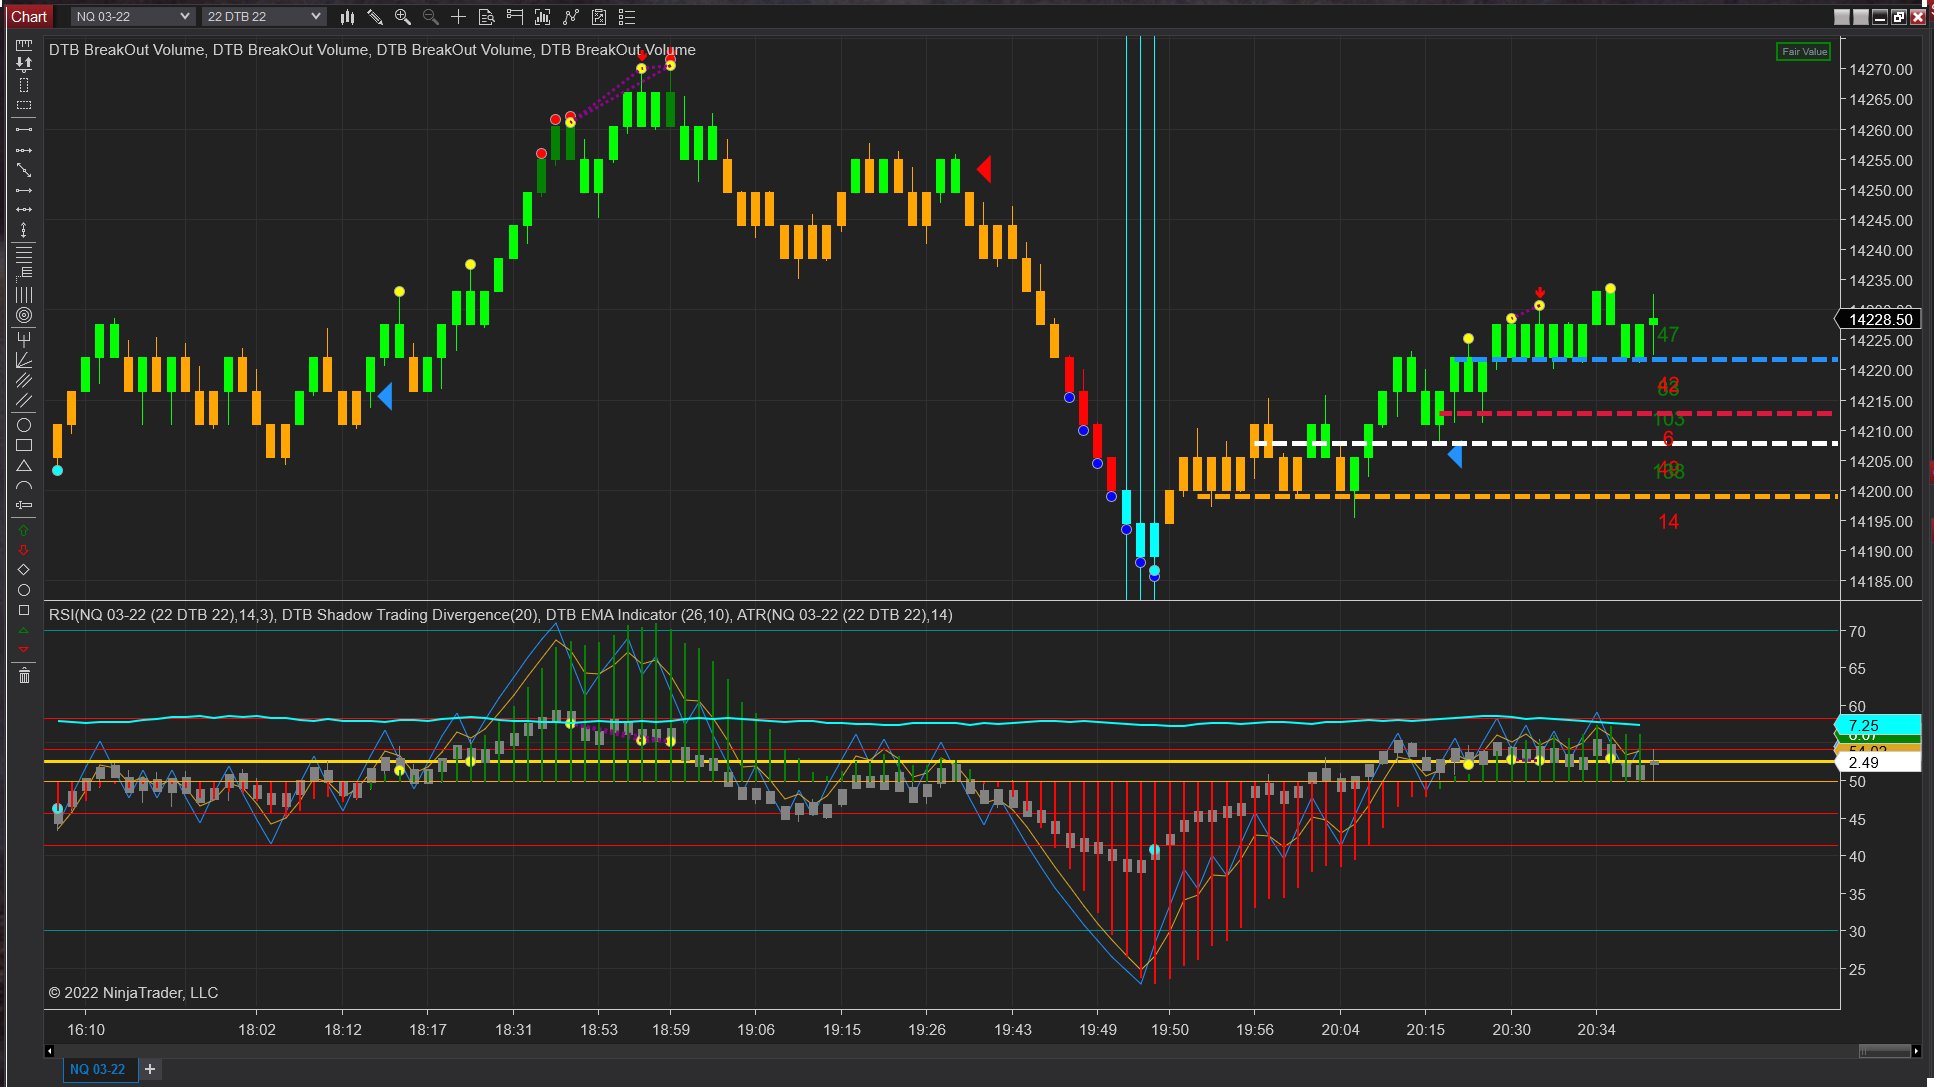
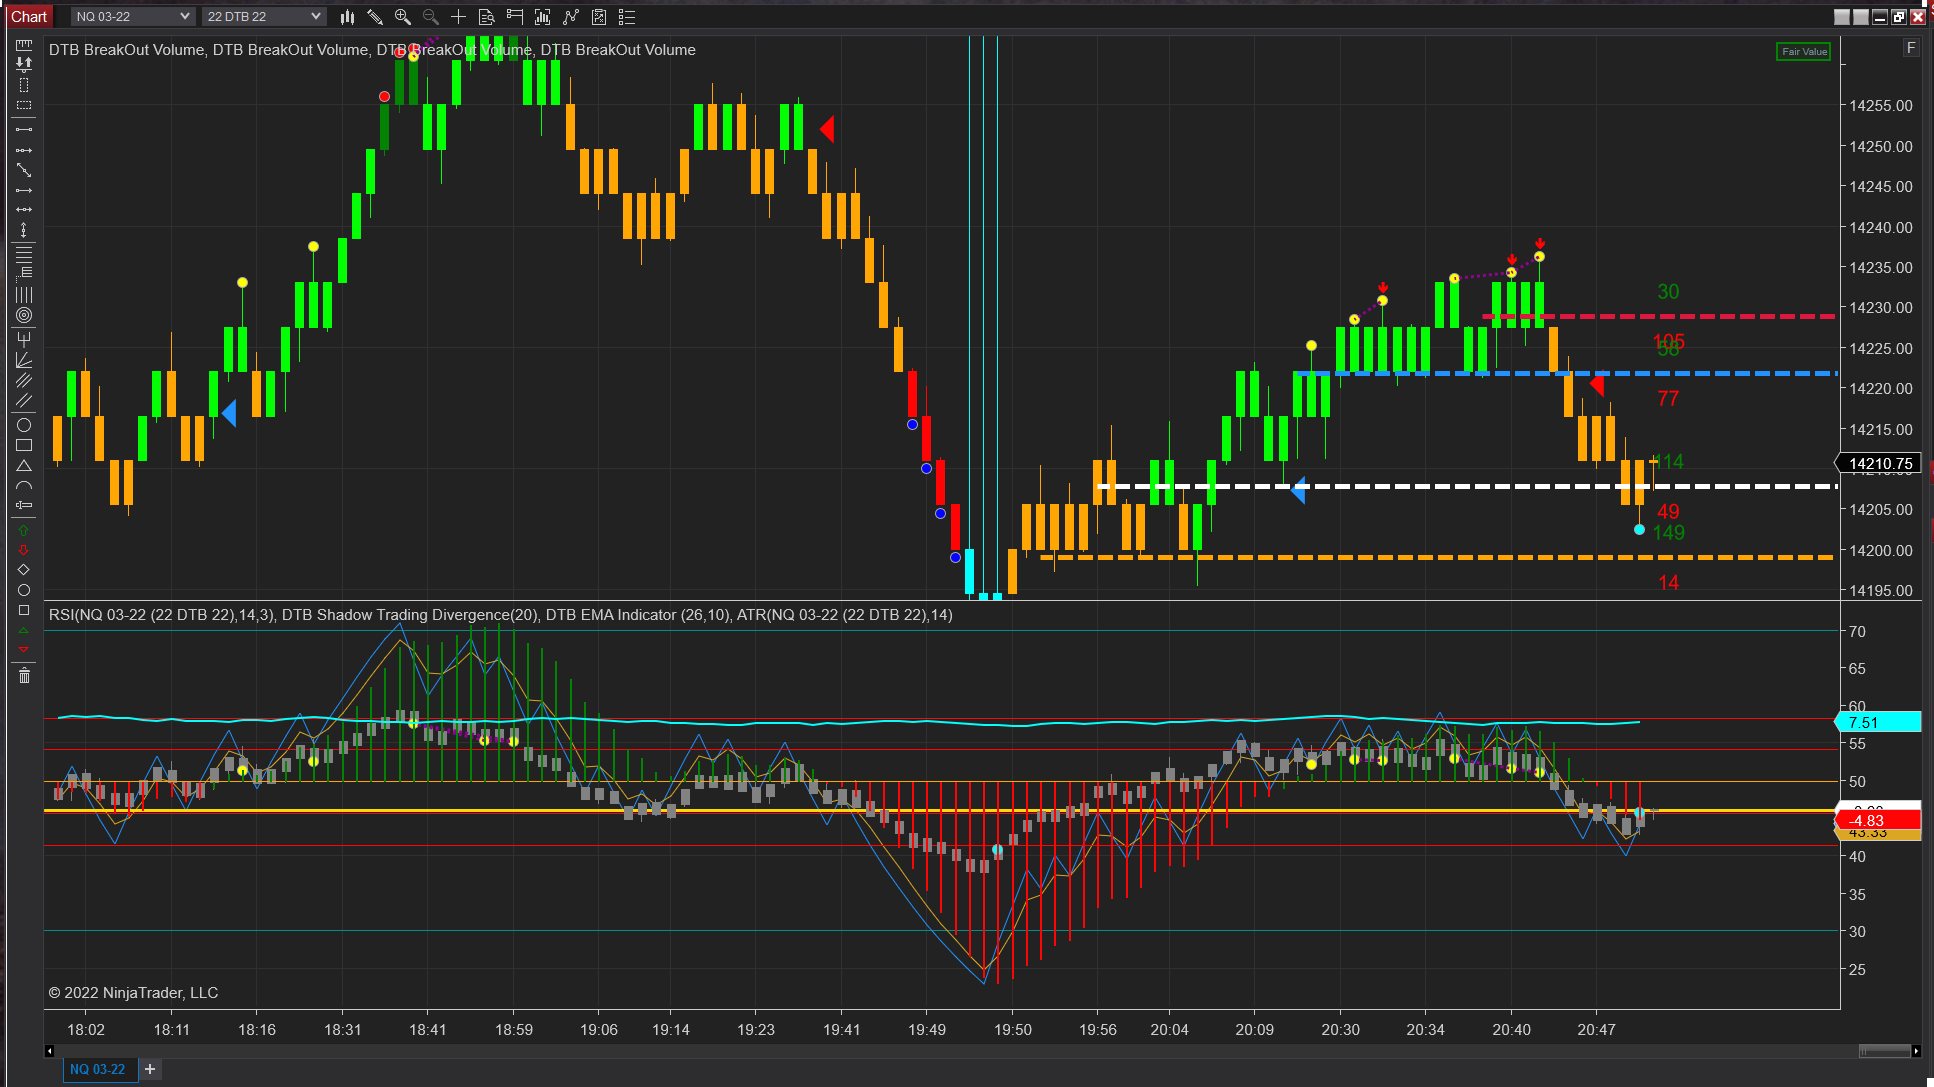
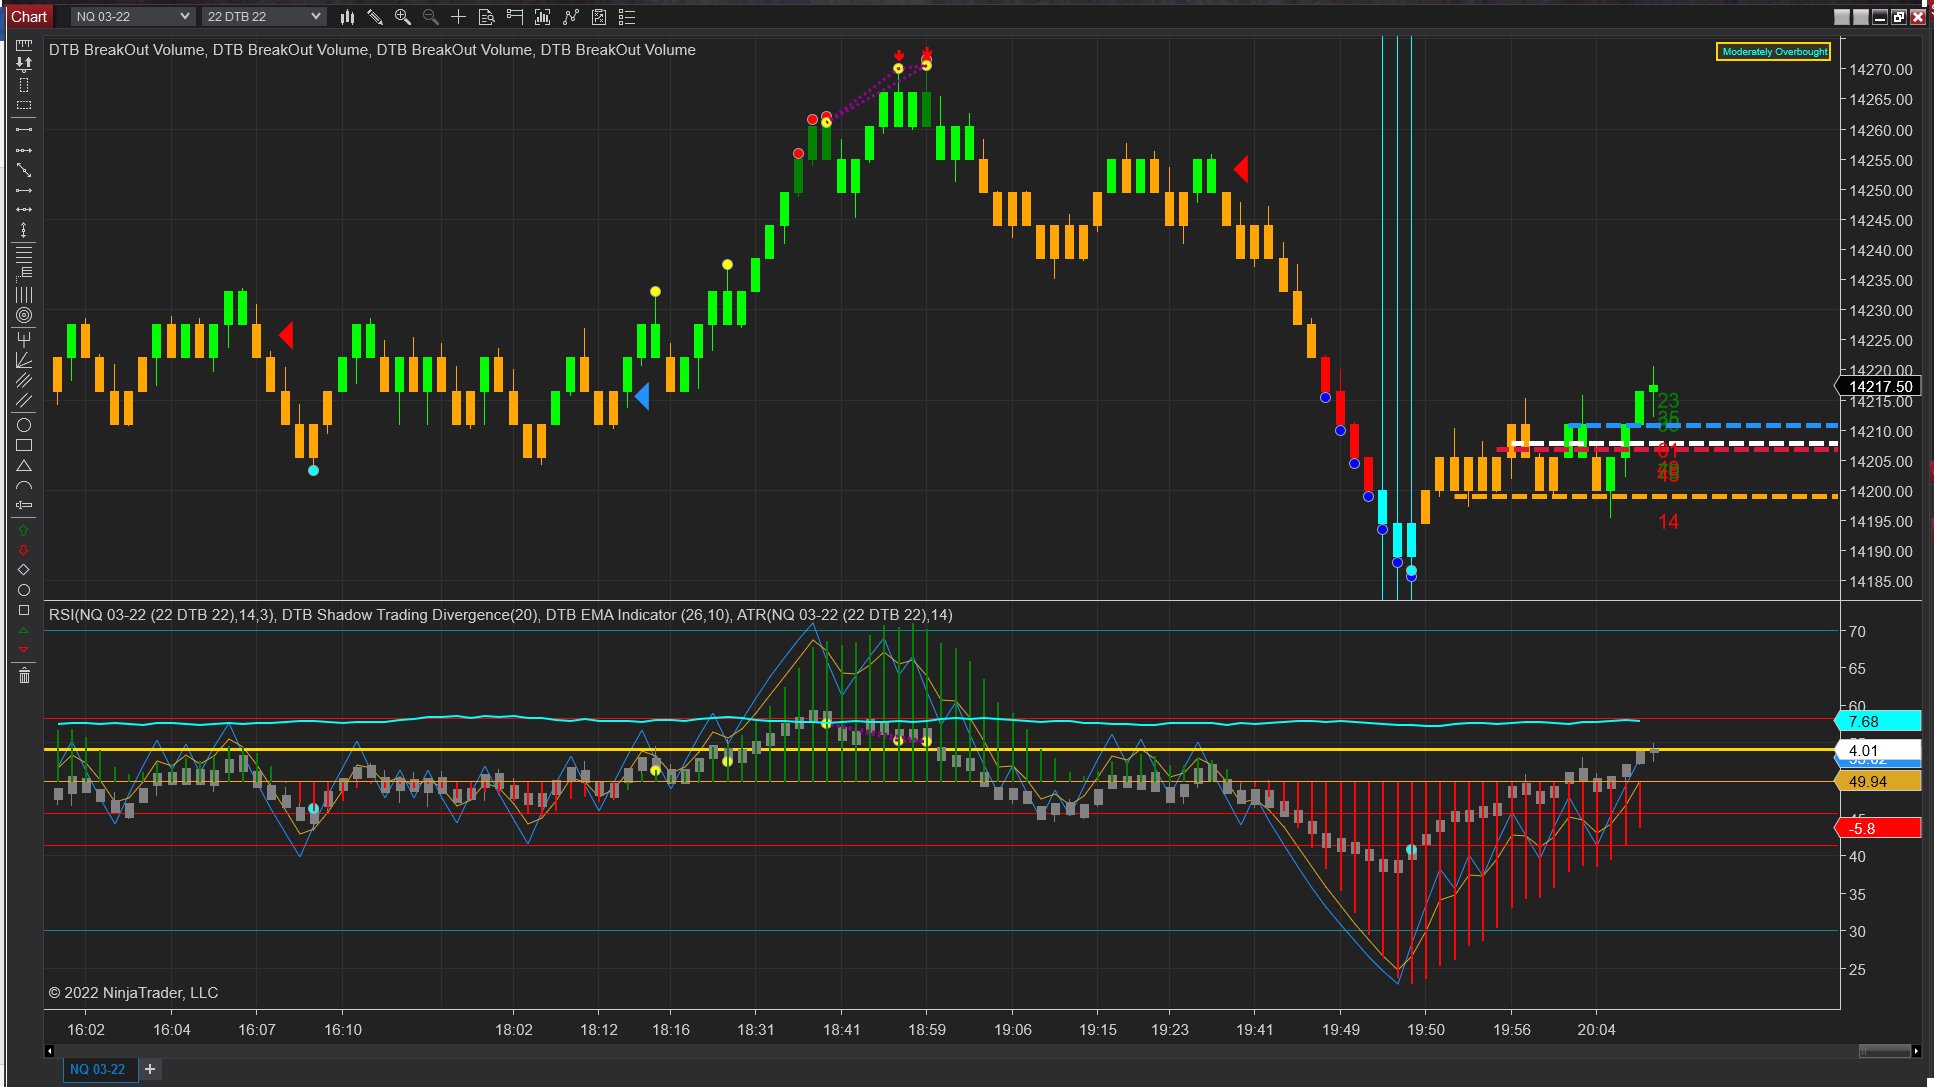
With the RSI, Shadow Trading Divergence, EMA and ATR all in Panel 2, this is a very clean setup of the chart on Panel 1, the main chart window.
How to work with this setup and what to act on:
· The 1st clear detail on Panel 1 is the red or blue triangle, this is part of the EMA indicator and shows you when price has broken above the Zero line and is in buyers’ territory, we will then only look for trades in the direction of this signal initially. The coloring of the bars are determined by the Shadow Trading Divergence, when bars are predominantly Green the price is in buyers’ territory and when Orange, sellers’ territory – when acting on a signal and deciding on whether to stay in a position or not, let this be a guide.
· After catching that 1st signal you will be watching for the Divergences on Panel 1 that very often signal a reversal in price, this is a good exit point or an opportunity to bring in your ATM stop closer to price.
· You will notice Cyan vertical lines for significantly over sold and Magenta vertical lines for significantly over bought (there is even an audible alert you can set in the indicator settings to draw your attention to this) When these Cyan or Magenta lines appear, watch 1st to see what the RSI and EMA Green/Red bars are doing before entering a reversal trade, this approach can very often get you in right near the top or bottom of the price action and allows for a very small stop loss, literally 1 or 2 bars but with the opportunity to take 5-10+ bars profit just scalping the market!
· The BreakOut Volume signals are BEYOND exceptional in that they paint EXACTLY to the tick and stay there while valid. You can see the tremendous results in these signals by looking at the Red and Green numbers above and below their line, these values tell you exactly how many ticks each of these signals have given, both above and below their exact point. It is important to know that these are NOT repainted signals AFTER the fact, but in absolute real time, displaying in the same location on any chart you load up. When price closes either side of these signals, they are great entry points too, in the direction of the EMA! Side note, work is being done to create an automated strategy out of them as part of a signal chart.
· The ATR, once price is nearing the ATR, it is either going to bounce off or break through, watch for Divergences at these points and even use close proximity to the ATR as a target for your ATM, take reversal trades when at the ATR, this will get you into a position even before the EMA triangle pops up, which again, allows for a very small Stop and a Larger profit potential, especially when you enter an additional position when the triangle pops up!!
· This explanation above and the template, may be, over time, slightly modified, with slight setting adjustments (as currently all indicators are on default settings when originally posted) – but the great thing is that whenever you run the Script, this template will be adjusted too, so it is an idea to save a separate version of this template without the DTBTT00 at the end so your modifications you make will not be replaced when running the Script. I am also including a Document in the DTB Archive folder for this tool so when you run the Script, it will be downloaded too for future reference and can be referred to when 1st learning how to reads the signals.