Fibonacci Levels – Institutional Support and Resistance levels
Have you ever wondered where the true support and resistance levels are, what the Banks, Hedge Funds and other Market movers use to determine Support and Resistance?
Fibonacci Levels are crucial for banks and institutions trading the Futures market because they serve as a fundamental technical analysis tool that helps in identifying potential reversal levels on price charts. These levels are derived from the Fibonacci sequence, a series of numbers where each number is the sum of the two preceding ones. This sequence finds its way into trading through Fibonacci ratios like 23.6%, 38.2%, 50%, 61.8%, and 100%, which are used to identify key support and resistance levels.
Banks and institutions heavily rely on these levels because they are widely recognized and respected by traders across the market, creating a self-fulfilling prophecy as these levels often act as barriers where price movements can halt or reverse. The correlation of Fibonacci levels with market psychology and historical price movements enhances their reliability. When a significant number of market participants watch and react to these levels, they can influence the supply and demand dynamics, thereby affecting price action. This collective observation and reaction to Fibonacci levels make them an integral part of trading strategies, offering banks and institutions a structured way to evaluate market trends, potential entry and exit points, and manage risk more effectively.
The DTB Fibonacci levels offer an unparalleled accuracy and comprehensive visualization, automatically adjusting as prices reach new highs or lows. This feature significantly reduces the time professional traders spend on analysis, potentially saving hours each day, even when applied to a single instrument. Given the correlation between various instruments, it’s crucial to apply these Fibonacci levels to associated instruments as well, since strong support or resistance levels in one can impact not only its own price but also those of correlated instruments. This critical insight is often overlooked by self-proclaimed experts who argue that Fibonacci levels are ineffective, citing instances where price did not respond to these levels on a specific instrument. However, the real challenge lies in their lack of access to accurate tools for displaying these levels and their failure to compare them across correlated instruments.
The DTB Fibonacci Levels stand out by allowing users to apply them to multiple instruments simultaneously, enabling immediate analysis without the need for countless hours spent on manual plotting. This represents a significant advantage, streamlining the trading process for those who utilize these levels correctly.
The DTB Fibonacci Levels offer a comprehensive range of time frames, including Monthly, Weekly, 240 Minute, 60 Minute, and 5 Minute levels. This enables traders to conduct both short-term and long-term analysis, identifying critical levels over an extended period. As of now, DTB Traders stands alone in providing such a thorough tool for Fibonacci level analysis which also includes Historical Plot levels for analysis and automated strategy creation.
Many others have attempted to produce similar tools for reading and plotting Fibonacci levels, but these efforts have fallen short, proving to be ineffective for comprehensive price analysis.
Here let’s take a look at how the Fibonacci levels appear on the trading chart, Nasdaq:
Here let’s take a look at how the Fibonacci levels appear on the trading chart, E-mini S&P 500 Futures: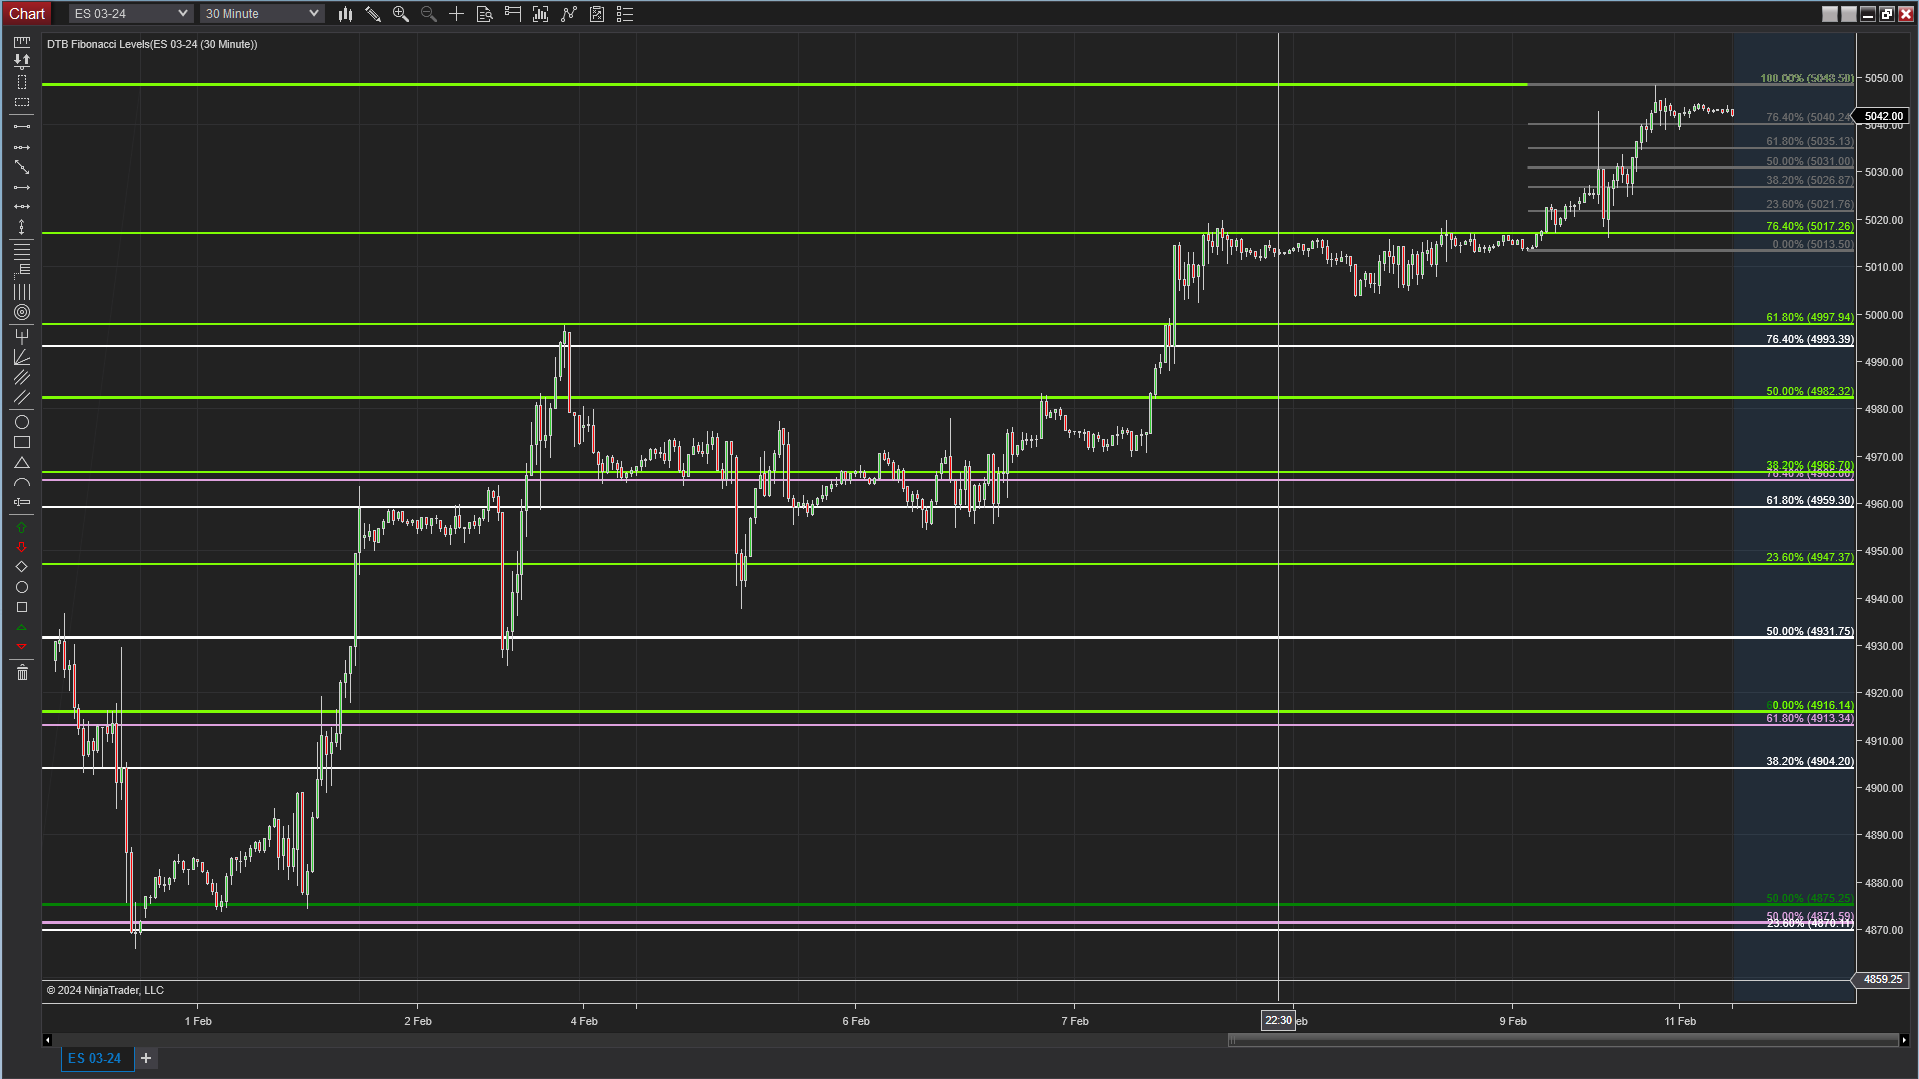
Numerous settings can be updated to reflect very specific levels if needed, as well as the option to select the historic Plots:
Want to use this powerful tool in your trading and others like it?
Review our Membership levels to receive this invaluable tool as well as over 60 other carefully selected indicators and automated strategies that make up the Complete system of tools, all available and included with a Subscription, 1 price for EVERYTHING so NO course fees, NO purchasing individual bits and pieces…..a COMPLETE System designed to work for you:
Membership subscription options:
3 months @ $570 ($190/month average)
6 months @ $1080 ($180/month average) ,and
12 months @ $2040 ($170/month average)
Thank you, Jason and the DTB Traders Team!